**All the writing in this blog that is BLUE is my notes (besides some links)**.

Pandas and DataFrames

In this lesson we will be exploring data analysis using Pandas.

  • College Board talks about ideas like
    • Tools. "the ability to process data depends on users capabilities and their tools"
    • Combining Data. "combine county data sets"
    • Status on Data"determining the artist with the greatest attendance during a particular month"
    • Data poses challenge. "the need to clean data", "incomplete data"
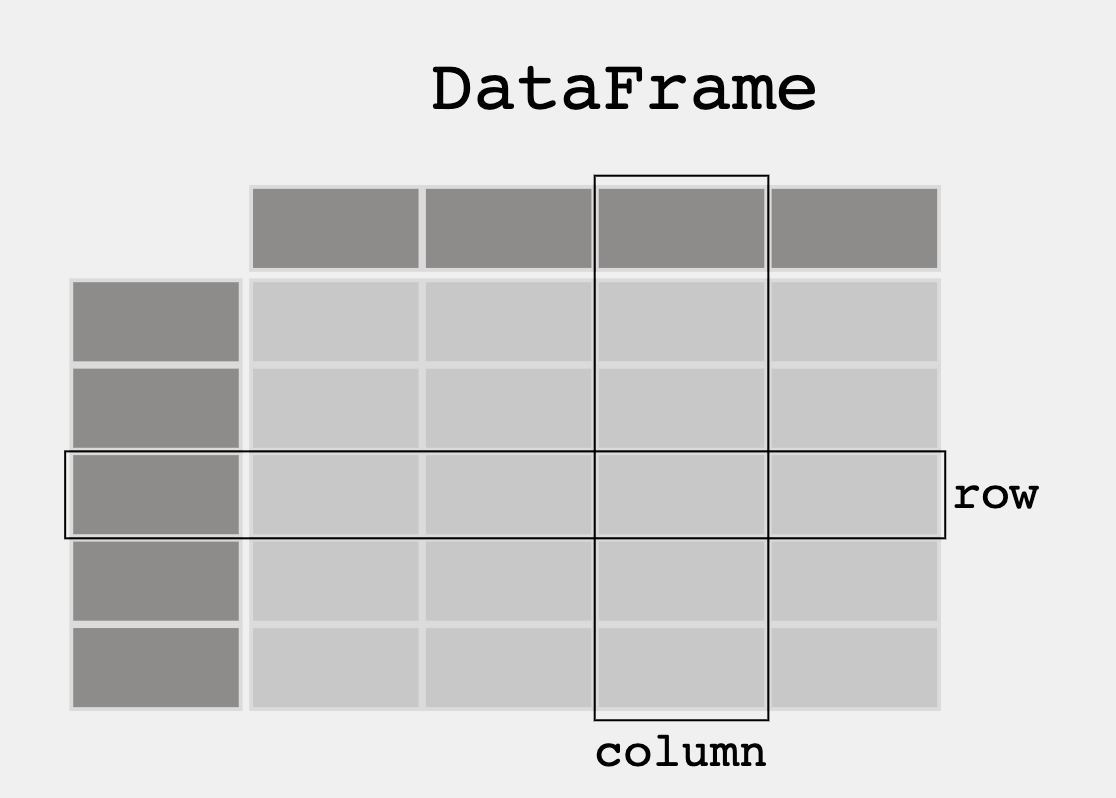
  • From Pandas Overview -- When working with tabular data, such as data stored in spreadsheets or databases, pandas is the right tool for you. pandas will help you to explore, clean, and process your data. In pandas, a data table is called a DataFrame.

DataFrame

'''Pandas is used to gather data sets through its DataFrames implementation'''
import pandas as pd

Cleaning Data

When looking at a data set, check to see what data needs to be cleaned. Examples include:

  • Missing Data Points
  • Invalid Data
  • Inaccurate Data

Run the following code to see what needs to be cleaned

import pandas as pd
df = pd.read_json('files/grade.json')

print(df)
# What part of the data set needs to be cleaned?
# From PBL learning, what is a good time to clean data?  Hint, remember Garbage in, Garbage out?
   Student ID Year in School   GPA
0         123             12  3.57
1         246             10  4.00
2         578             12  2.78
3         469             11  3.45
4         324         Junior  4.75
5         313             20  3.33
6         145             12  2.95
7         167             10  3.90
8         235      9th Grade  3.15
9         nil              9  2.80
10        469             11  3.45
11        456             10  2.75

This Dataframe is missing data points, has invalid data, and inaccurate Data. For index 9, the student ID is missing and it labeled 'nil'. In index 4 and 8, the Year in school doesn't match with the format of the other values in Year in School. In index 5, the year in school is 20 but it can only be 9-12.

Extracting Info

Take a look at some features that the Pandas library has that extracts info from the dataset

DataFrame Extract Column

print(df[['GPA']])

print()

#try two columns and remove the index from print statement
print(df[['Student ID','GPA']].to_string(index=False))
     GPA
0   3.57
1   4.00
2   2.78
3   3.45
4   4.75
5   3.33
6   2.95
7   3.90
8   3.15
9   2.80
10  3.45
11  2.75

Student ID  GPA
       123 3.57
       246 4.00
       578 2.78
       469 3.45
       324 4.75
       313 3.33
       145 2.95
       167 3.90
       235 3.15
       nil 2.80
       469 3.45
       456 2.75

DataFrame Sort

print(df.sort_values(by=['GPA']))

print()

#sort the values in reverse order
print(df.sort_values(by=['GPA'], ascending=False))
   Student ID Year in School   GPA
11        456             10  2.75
2         578             12  2.78
9         nil              9  2.80
6         145             12  2.95
8         235      9th Grade  3.15
5         313             20  3.33
3         469             11  3.45
10        469             11  3.45
0         123             12  3.57
7         167             10  3.90
1         246             10  4.00
4         324         Junior  4.75

   Student ID Year in School   GPA
4         324         Junior  4.75
1         246             10  4.00
7         167             10  3.90
0         123             12  3.57
3         469             11  3.45
10        469             11  3.45
5         313             20  3.33
8         235      9th Grade  3.15
6         145             12  2.95
9         nil              9  2.80
2         578             12  2.78
11        456             10  2.75

DataFrame Selection or Filter

print(df[df.GPA > 3.00])
   Student ID Year in School   GPA
0         123             12  3.57
1         246             10  4.00
3         469             11  3.45
4         324         Junior  4.75
5         313             20  3.33
7         167             10  3.90
8         235      9th Grade  3.15
10        469             11  3.45

DataFrame Selection Max and Min

print(df[df.GPA == df.GPA.max()])
print()
print(df[df.GPA == df.GPA.min()])
  Student ID Year in School   GPA
4        324         Junior  4.75

   Student ID Year in School   GPA
11        456             10  2.75

Create your own DataFrame

Using Pandas allows you to create your own DataFrame in Python.

Python Dictionary to Pandas DataFrame

import pandas as pd

#the data can be stored as a python dictionary
dict = {
  "calories": [420, 380, 390, 999],
  "duration": [50, 40, 45, 999]
}
#stores the data in a data frame
print("-------------Dict_to_DF------------------")
df = pd.DataFrame(dict)
print(df)

print("----------Dict_to_DF_labels--------------")

#or with the index argument, you can label rows.
df = pd.DataFrame(dict, index = ["day1", "day2", "day3", "day4"])
print(df)
-------------Dict_to_DF------------------
   calories  duration
0       420        50
1       380        40
2       390        45
3       999       999
----------Dict_to_DF_labels--------------
      calories  duration
day1       420        50
day2       380        40
day3       390        45
day4       999       999

Examine DataFrame Rows

print("-------Examine Selected Rows---------")
#use a list for multiple labels:
print(df.loc[["day1", "day3"]])

#refer to the row index:
print("--------Examine Single Row-----------")
print(df.loc["day1"])
-------Examine Selected Rows---------
      calories  duration
day1       420        50
day3       390        45
--------Examine Single Row-----------
calories    420
duration     50
Name: day1, dtype: int64

Pandas DataFrame Information

print(df.info())
<class 'pandas.core.frame.DataFrame'>
Index: 4 entries, day1 to day4
Data columns (total 2 columns):
 #   Column    Non-Null Count  Dtype
---  ------    --------------  -----
 0   calories  4 non-null      int64
 1   duration  4 non-null      int64
dtypes: int64(2)
memory usage: 268.0+ bytes
None

Example of larger data set

Pandas can read CSV and many other types of files, run the following code to see more features with a larger data set

import pandas as pd

#read csv and sort 'Duration' largest to smallest
df = pd.read_csv('files/data.csv').sort_values(by=['Duration'], ascending=False)

print("--Duration Top 10---------")
print(df.head(10))

print("--Duration Bottom 10------")
print(df.tail(10))
--Duration Top 10---------
     Duration  Pulse  Maxpulse  Calories
69        300    108       143    1500.2
79        270    100       131    1729.0
109       210    137       184    1860.4
60        210    108       160    1376.0
106       180     90       120     800.3
90        180    101       127     600.1
65        180     90       130     800.4
61        160    110       137    1034.4
62        160    109       135     853.0
67        150    107       130     816.0
--Duration Bottom 10------
     Duration  Pulse  Maxpulse  Calories
68         20    106       136     110.4
100        20     95       112      77.7
89         20     83       107      50.3
135        20    136       156     189.0
94         20    150       171     127.4
95         20    151       168     229.4
139        20    141       162     222.4
64         20    110       130     131.4
112        15    124       139     124.2
93         15     80       100      50.5

APIs are a Source for Writing Programs with Data

3rd Party APIs are a great source for creating Pandas Data Frames.

  • Data can be fetched and resulting json can be placed into a Data Frame
  • Observe output, this looks very similar to a Database
'''Pandas can be used to analyze data'''
import pandas as pd
import requests

def fetch():
    '''Obtain data from an endpoint'''
    url = "https://flask.nighthawkcodingsociety.com/api/covid/"
    fetch = requests.get(url)
    json = fetch.json()

    # filter data for requirement
    df = pd.DataFrame(json['countries_stat'])  # filter endpoint for country stats
    print(df.loc[0:5, 'country_name':'deaths']) # show row 0 through 5 and columns country_name through deaths
    
fetch()
  country_name       cases     deaths
0          USA  82,649,779  1,018,316
1        India  43,057,545    522,193
2       Brazil  30,345,654    662,663
3       France  28,244,977    145,020
4      Germany  24,109,433    134,624
5           UK  21,933,206    173,352

Hacks

  • Does it have a good sample size?

The sample size is 9 but is consided a good sample of the code because it uses ALL the 9 episodes of star wars to determine which episode was the most loved and most hated. Doesn't including another other movies and doesn't excluded any of the episodes.

  • Is there bias in the data?

Most of the values in the subcategories are determined by how much people liked or disliked a given star wars movie, which involves personal bias. However, the computer doesn't have bias because it is using correct and clean data and is not including and/or excluded pieces of infomation when running.

  • Does the data set need to be cleaned?

The data set below doesn't need to be cleaned. It was created with the intent to have clean and correct data.

  • What is the purpose of the data set?

The purpose of the data set is to find out which star wars movie is loved the most and loved the least by both Audience score and Rotten Tomatoes. It is to help people know what both parties think of a moive and determine which one is favored by both parties.

import pandas as pd

#the data is stored in a python dictionary
dict = {
  "Audience": [59, 56, 66, 96, 97, 94, 85, 42, 86],                     # Audience Score
  "Rotten Tomatoes": [51, 65, 79, 93, 94, 83, 93, 91, 52],              # Rotten Tomatoes Score
  "Duration": [133, 143, 140, 121, 124, 133, 136, 152, 142],            # Movie's Runtime
  "money made(millions)":[431, 302, 380, 307, 209, 252, 936, 620, 515]  # Money the movie made in the millions
}
#or with the index argument, you can label rows.
df = pd.DataFrame(dict, index = ["The Phantom Menace", "Attack of the Clones", "Revenge of the Sith", "A New Hope", "Empire Strikes Back", "Return of the Jedi", "The Force Awakens", "The Last Jedi", "The Rise of Skywalker"])


df['Loved by all'] = 100 * ((df['Rotten Tomatoes'] + df['Audience']) / 200) # finds the ratings total and divides it by the highest possible rating and *100 to make it a %.
dfLovedbyAll = (df.sort_values(by='Loved by all', ascending=False)) # sets the base list to the variable dfLovedbyAll
print(dfLovedbyAll[['Audience','Rotten Tomatoes','Loved by all']].to_string(index=True)) # prints the data based on % that all rated the moive (Highest to lowest).
print() #spaces out the data
print(dfLovedbyAll[['Audience','Rotten Tomatoes','Loved by all']].head(1)) # prints the Highest Loved by All %.
print() #spaces out the data
print(dfLovedbyAll[['Audience','Rotten Tomatoes','Loved by all']].tail(1)) # prints the Lowest Loved by All %.
                       Audience  Rotten Tomatoes  Loved by all
Empire Strikes Back          97               94          95.5
A New Hope                   96               93          94.5
The Force Awakens            85               93          89.0
Return of the Jedi           94               83          88.5
Revenge of the Sith          66               79          72.5
The Rise of Skywalker        86               52          69.0
The Last Jedi                42               91          66.5
Attack of the Clones         56               65          60.5
The Phantom Menace           59               51          55.0

                     Audience  Rotten Tomatoes  Loved by all
Empire Strikes Back        97               94          95.5

                    Audience  Rotten Tomatoes  Loved by all
The Phantom Menace        59               51          55.0